Have you ever found yourself wishing you could debug CoffeeScript in the browser? In fact, this was one of the argument against CoffeeScript - it makes hard to debug, as generated JavaScript isn’t very readable. It was never an issue for me. However, it would be nice if we could debug CoffeeScript in the browser. CoffeeScript version 1.6.1 introduced support for Source Maps. Source Map provides line-mapping between your CoffeeScript code and generated JavaScript. Chrome and Firefox support source maps, following are the steps for using source maps.
Generate Source Maps
Upgrade CoffeeScript to 1.6.1 or higher version, if you are running the old version and add the –map or -m argument to the CoffeeScript compiler. After adding this flag, you will see .map file for each of your CoffeeScript files. At the end of the JavaScript files, you will see a comment block, referring to the map file.
/*
//@ sourceMappingURL=app.map
*/
Enable Source Map support in the DevTools
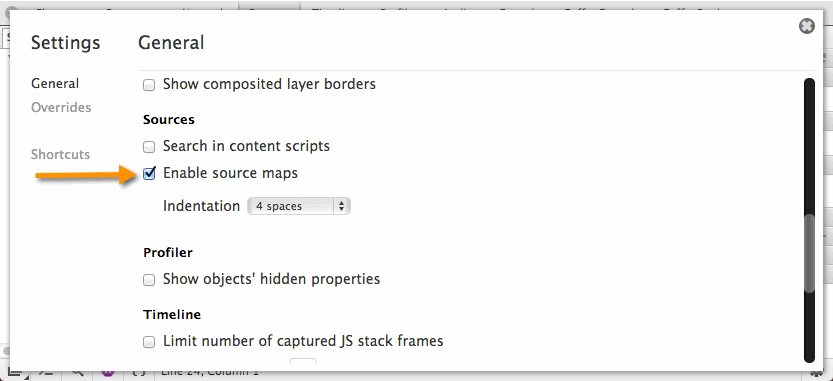
Check the option at DevTools > Settings > General > Enable Source Maps

Make .map and .coffee Accessible to Browser
You might have to update your web server configuration, so that it allows DevTools to download the .map and .coffee files. If you are using IIS, add Mime Type handlers for .map and .coffee file extensions as plain/text.
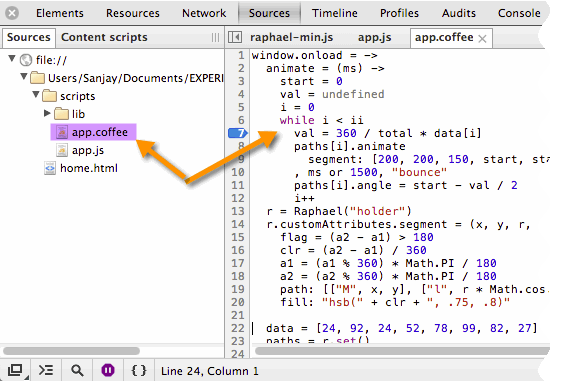
That’s it, refresh your browser and you should be able to see the coffee files along with your JavaScript files under the sources tab of the DeveTools. Now, you will be able to put the breakpoints and debug through the CoffeeScript same as any JavaScript code.
